Category:
Data Visualization, Media.
Client:
Mayank Loonker
Day Visualized
Data Visualization, Media.

🎧 Project Title:
Day in Sound: Mapping the Sonic Pulse of a Design Studio
📄 Project Brief:
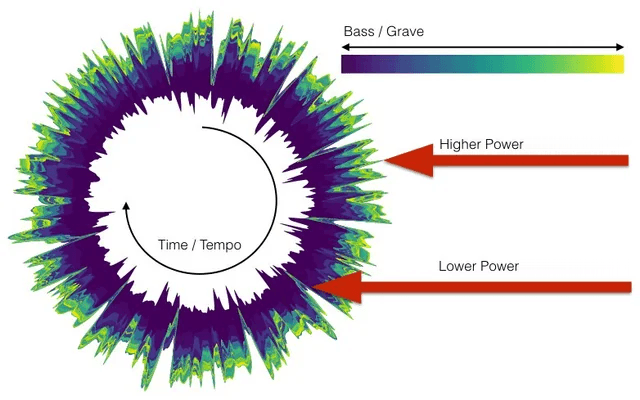
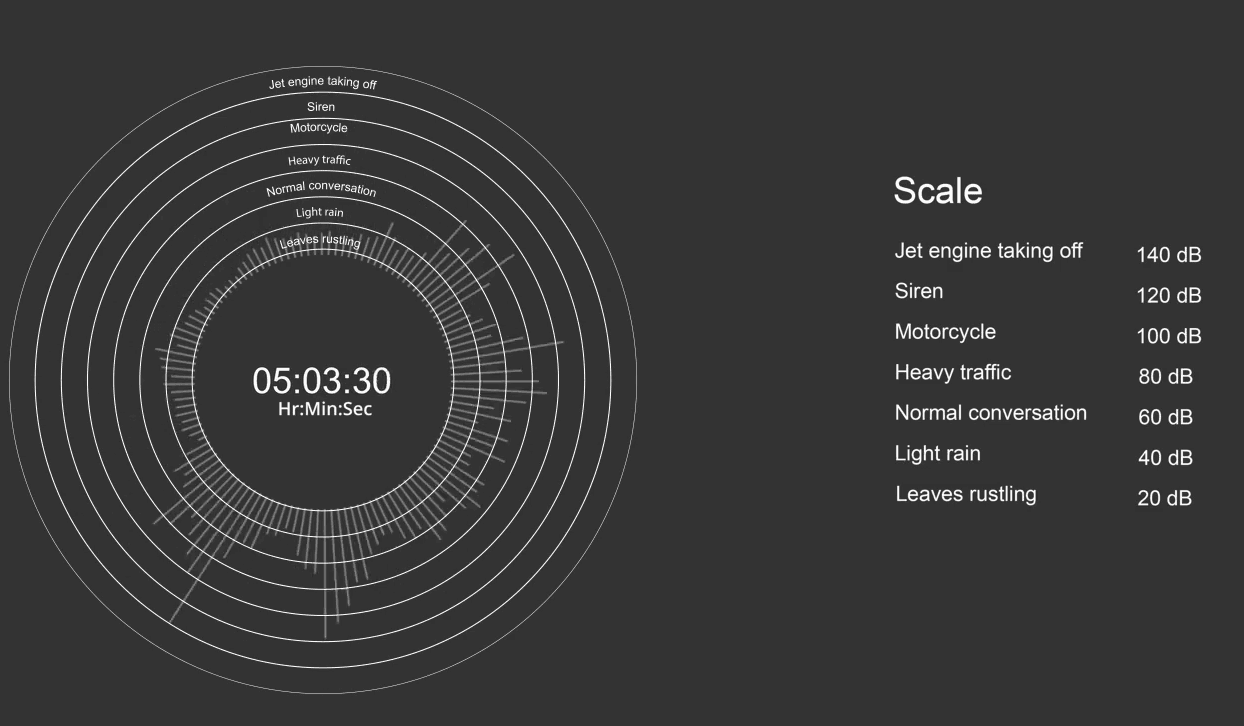
This project visualizes the auditory environment of a design studio across a span of 7 Hours. By translating decibel levels into a layered radial graph and timeline waveform, I explored how ambient and disruptive sounds shape our daily workspace experience. The data was categorized into recognizable sound levels from rustling leaves (20 dB) to jet engines (140 dB) to ground the visualization in a relatable context.
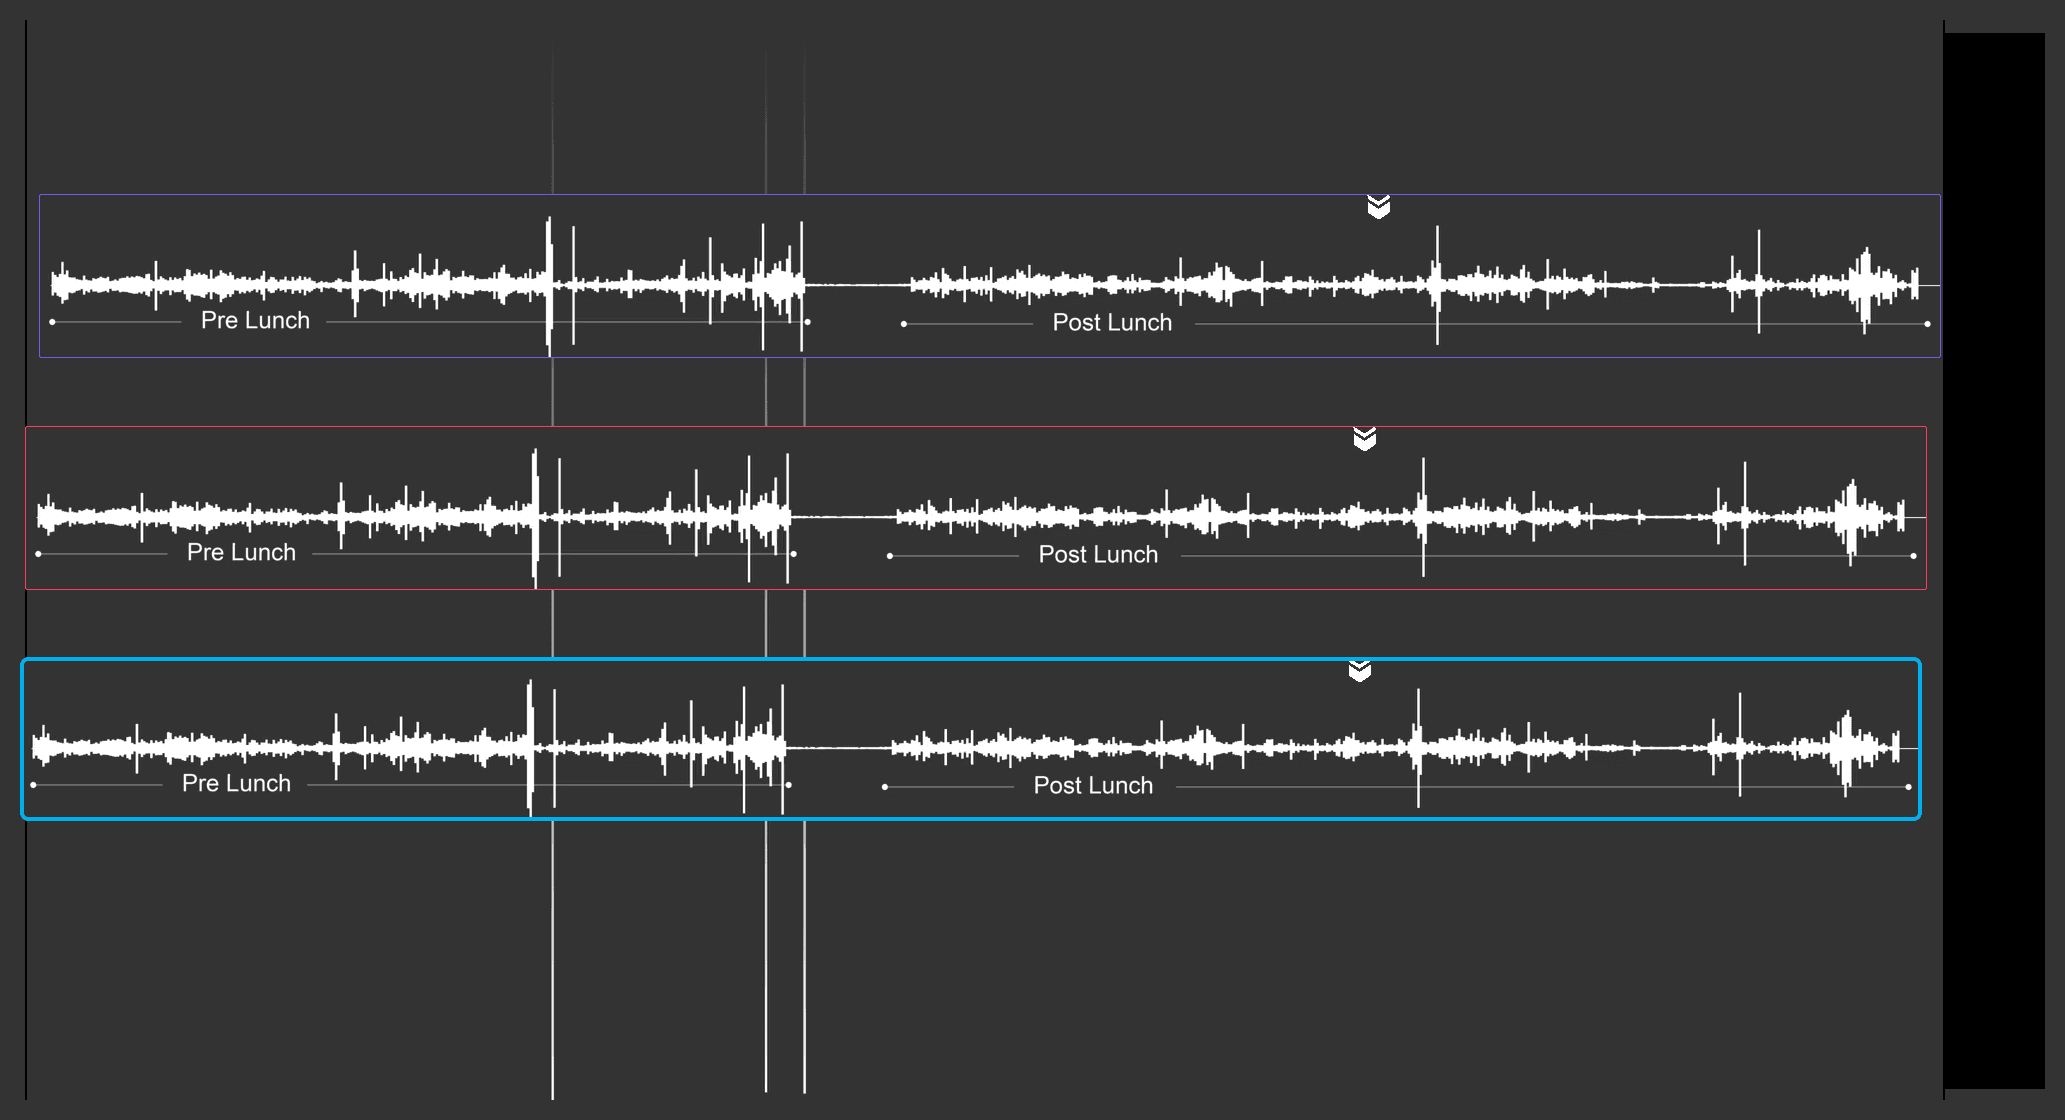
The circular visualization maps sound intensity over time, while the horizontal waveform helps distinguish pre- and post-lunch acoustic dynamics. This project blends information design and user experience thinking to highlight the unseen (or unheard) dimension of our work life sound.
🛠 Tools & Techniques:
Sound recording & sampling
Decibel level categorization
Radial and linear visualization design
Data cleaning and normalization
Adobe Illustrator / Processing / Python (adjust depending on your tools)
🧠 Key Learnings:
Translating ambient experiences into measurable data
Balancing aesthetics with functional legibility
Iterative visualization for best pattern recognition

